Economy
Access economic data related to Curaçao on this page.
Inflation
2024 | 2025 | |
Inflation (%) | 2,6 | 2,0 |
CPI 12 month average | 102.6 | 104,7 |
Series for total inflation price index numbers based on price reference period 2023 (average 2023 = 100)
To access data from previous years and more detailed information, please visit the main website Inflation/Prices | Central Bureau of Statistics Curaçao
Economy
Curaçao Economic Indicators
Gross Domestic Product (GDP) | 2023 | 2024 | 2025 |
| Domestic Product Gross, market prices | 5873.7 | 6374.5 | 6838.6 |
| Nominal GDP growth (in%) | 6.7 | 8.7 | 7.1 |
| Real GDP growth (in%) | 4.2 | 5.0 | 5.1 |
GDP per capita | 2022 | 2023 | 2024 |
| GDP per capita at market prices, nominal (ANG) | 36698 | 38548 | 41025 |
| Annual growth rate of nominal GDP per capita (%) | 14.0 | 5.0 | 6.4 |
| GDP per capita at market prices, real (ANG) | 35169 | 36074 | 41392 |
| Annual growth rate of real GDP per capita (%) | 8.6 | 2.6 | 3.0 |
Gross National Income (GNI) | 2022 | 2023 | 2024 |
|---|---|---|---|
| Gross National Income (GNI), at current market prices (mln ANG) | 5570.5 | 5922.6 | 6431.5 |
| Gross National Income (GNI) per capita, at current market prices (ANG) | 37137 | 38869 | 41392.1 |
| Annual growth rate Gross National Income (GNI) per capita (%) | 13.3 | 4.7 | 6.3 |
| Inflation | 7.4 | 3.5 | 2.6 |
Notes: * Estimated figures
Figures updated per June 2023
** From 2022 forward the GDP constant is calculated using a new method. GDP constant is corrected per industry, by their corresponding prices.
Due to the use of a new method there is trend break in the calculations.
Updated per June 2024
To access data from previous years and more detailed information, please visit the main website Economy | Central Bureau of Statistics Curaçao
Public Finances
2023 | 2024 | |
| Government revenues (x mln ANG) | 1,771.4 | 1,967.5 |
| Government expenditures (x mln ANG) | 1,729.6 | 1,925.0 |
2023 | 2024 | |
| Income from direct taxes (x mln ANG) | 527.7 | 571.7 |
| Income from indirect taxes (x mln ANG) | 1096.7 | 1,220.40 |
For data from previous years and detailed information, please visit the website www.cbs.cw.
Budget Expenditure Survey
BUDGET EXPENDITURE SURVEY 2016
Average absolute/relative annual spending by categories, in NAf | ||
| Spending categories | Average spending (Absolute) | Average spending (Relative) |
| Food and non-alcoholic beverages | 5604 | 12.1% |
| Alcoholic beverages, tobacco | 414 | 0.9% |
| Clothing and footwear | 1464 | 3.2% |
| Housing | 11502 | 24.9% |
| Furnishings and household equipment | 4957 | 10.7% |
| Health | 832 | 1.8% |
| Transport | 6095 | 13.2% |
| Communication | 3092 | 6.7% |
| Recreation and culture | 4774 | 10.3% |
| Education | 480 | 1.0% |
| Hotel and Restaurant | 1032 | 2.2% |
| Total | 5978 | 12.9% |
| Total | 46223 | 100% |
*local purchases
For detailed information about this topic please go to our main website Household Budget Survey 2016 | Central Bureau of Statistics Curaçao (cbs.cw)
International Trade
2020 | 2021 | |
| Total imports, exclusive oil and oil products (in mln ANG) | 1795 | 1908 |
| Total exports, exclusive oil and oil products (in mln ANG) | 147 | 156 |
Imports by main country (%) | 2020 | 2021 |
| USA | 31.8 | 31.6 |
| Netherlands | 25.9 | 28.2 |
| Puerto Rico | 3.4 | 2.9 |
| Venezuela | 1.3 | 0.6 |
| Panama | 6.3 | 6.8 |
| Rest of the world | 31.3 | 29.9 |
Export by main country (%) | 2019 | 2020 | 2021 |
| USA | 9.1 | 10.2 | 10.9 |
| Aruba | 10.8 | 12.2 | 11.5 |
| Netherlands | 20.5 | 14.3 | 17.9 |
| Bonaire | 30.8 | 33.3 | 35.9 |
| St Maarten | 4.5 | 2.7 | 2.6 |
| Rest of the world | 23.8 | 27.2 | 21.2 |
For data from previous years and detailed information, please visit the website International Trade | Central Bureau of Statistics Curaçao (cbs.cw)
Enterprises
Registered companies in the CBS Business Register as of 2025 | |
| Type of company | Total |
| Small companies | 9232 |
| Medium companies | 1258 |
| Large companies | 184 |
| Total | 10.674 |
| Definition |
Total active registered companies per January1st at | 2023 | 2024 | 2025 |
| Total | 39.708 | 40.117 | 40.230 |
| International | 8.327 | 8.220 | 32.378 |
| Local | 31.381 | 31.897 | 7.852 |
For data from previous years and detailed information, please visit the website Enterprises | Central Bureau of Statistics Curaçao (cbs.cw)
Business Cycle Survey 2023
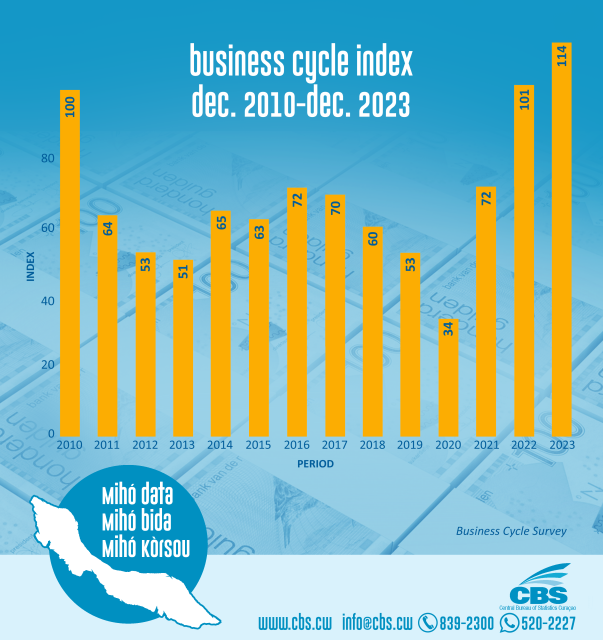
Business cycle index provide an overview of the state of the economy, constructed from various indicators. For the business index of Curaçao, this is based on data related to confidence in the future, the perception of the investment climate, and changes in turnover. These indicators are aggregated into a composite index, with a starting point of one hundred.
Since the end of 2010, the business index has shown a gradual upward trend after an initial sharp decline to 51 points in 2013. Following this, the index fluctuated before eventually declining to 53 points by December 2019, after several cycles of rises and falls. During the COVID-19 pandemic and lockdown, the index dropped sharply from 53 to 30 points by June 2020, compared to December 2019. Fortunately, the second half of 2020 saw no further decline, due to relaxed COVID measures and a subsequent increase in business activity
For detailed results of the Business Cycle Survey 2023 you can download the publication here : Results of the Business Cycle Survey 2023 | Central Bureau of Statistics Curaçao
Income
Male | Female | Total | |
| No Income | 1565 | 1474 | 3039 |
| 1 - 500 | 468 | 469 | 937 |
| 501 - 1000 | 1024 | 1605 | 2629 |
| 1001 - 1500 | 1511 | 2559 | 4070 |
| 1501 - 2000 | 1943 | 3127 | 5070 |
| 2001 - 2500 | 4044 | 5120 | 9164 |
| 2501 - 3000 | 2895 | 2735 | 5630 |
| 3001 - 3500 | 1833 | 1950 | 3783 |
| 3501 - 4000 | 2219 | 2370 | 4589 |
| 4001 - 4500 | 425 | 409 | 834 |
| 4501 - 5000 | 1281 | 1446 | 2727 |
| 5001 - 7500 | 3485 | 4349 | 7834 |
| More than 7500 | 2801 | 2162 | 4963 |
| Not Reported | 6056 | 5921 | 11977 |
| Grand Total | 31550 | 35696 | 67246 |
Age-group | Male | Female | Total |
| 15-24 | |||
| 25-34 | |||
| 35-44 | |||
| 45-54 | |||
| 55-64 | |||
| 65+ | |||
| Total |
For data from previous years and detailed information, please visit the website website